
 WikiCards
 Play on iPhone nowFree in Safari. Add it to your Home Screen.Play
WikiCards · Card list · Science cards · Data and information visualization
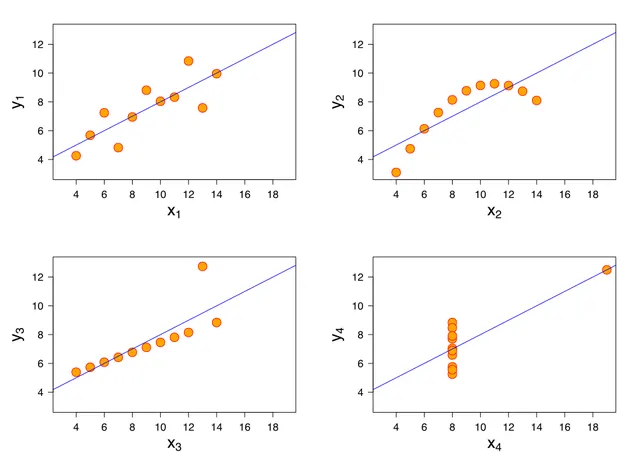
Uncommon card · Science
Data and information visualization, an Uncommon card
Data and information visualization is the practice of designing and creating graphic or visual representations of quantitative and qualitative data and information with the help of static, dynamic or interactive visual items.
- Rarity
- Uncommon
- Domain
- Science
- ATK
- 83
- DEF
- 75
- Power
- 158
- Wikipedia reads a year
- 37,000
Power 158 (ATK + DEF): stronger than 80 % of WikiCards cards.
Data and information visualization quiz: 3 questions
Three questions on the Data and information visualization card, the way WikiCards duels ask them. Pick an answer, the facts are just below.
Find the missing word
Data visualization is concerned with presenting sets of primarily quantitative raw data in a ______ form, using imagery.
Answer
schematic. Data visualization is concerned with presenting sets of primarily quantitative raw data in a schematic form, using imagery. From the Data and information visualization article on Wikipedia.
Which of these cards hits hardest (highest ATK)?
Answer
Data and information visualization. Data and information visualization 83 · Sense of smell 79 · Electrical connector 76 · Algol 72 ATK in WikiCards.
Which of these Wikipedia articles is read the most in a year?
Answer
Maxwell's equations. Maxwell's equations 580,000 · Hydrochloric acid 360,000 · Sense of smell 56,000 · Data and information visualization 37,000 Wikipedia reads over a year.
In a duel, each round asks a question like these about the opposing card, with 15 seconds to answer.
The facts on the card
The card carries these facts from its Wikipedia article.
- These visualizations are intended to help a target audience visually explore and discover, quickly understand, interpret and gain important insights into otherwise difficult-to-identify structures, relationships, correlations, local and global patterns, trends, variations, constancy, clusters, outliers and unusual groupings within data.
- When intended for the public to convey a concise version of information in an engaging manner, it is typically called infographics.
- Data visualization is concerned with presenting sets of primarily quantitative raw data in a schematic form, using imagery.
Why it is Uncommon
Rarity in WikiCards follows a year of Wikipedia page views: the most read articles become Epic and Legendary cards. The Data and information visualization article was read about 37,000 times in a year. ATK comes from the length of the article and DEF from its quality, so this card hits with 83 and blocks with 75: each hit it takes is cut by 30 %.
How to get Data and information visualization
Open packs. Each pack holds five cards drawn from real Wikipedia articles, the rarest last, and the fifth card is always Rare or better. The odds are shown in the game. A free pack arrives every hour and two can wait, and the Coins you win in duels buy more packs.
More Science cards








Cards close in power
The cards just above and just below Data and information visualization in the power ranking, all domains together.
- Sebastião José de Carvalho e Melo, 1st Marquis of PombalUncommon · History · ATK 77 DEF 81
- George AntheilUncommon · Arts · ATK 74 DEF 84
- Felony disenfranchisement in the United StatesUncommon · Society · ATK 81 DEF 77
- List of awards and nominations received by Jessica LangeUncommon · Arts · ATK 80 DEF 78
- Mia MartiniUncommon · Arts · ATK 79 DEF 79
- MaryportUncommon · Society · ATK 74 DEF 84
Card lists
- Wikipedia quizNew questions every day
- All cards from A to ZEvery card, by name
- Science cards
- Legendary cards
- Tier listS and A tiers by power (ATK + DEF)
Credits
Text : Wikipedia, Data and information visualization (revision), CC BY-SA 4.0. Photo : Anscombe.svg : Schutz (label using subscripts): Avenue, CC BY-SA 3.0, Wikimedia Commons.
